1. Capital Project Misbehaviour
Despite the overall professional pride of engineers, project managers, and general managers, the general overview of capital projects performance shows a rather dire result.
In the week we write this document we have learnt about line #12 in London subway: at least one year and 3,000 million pounds will have to be added to the original estimates.
This example may be a case of "cherry picking", and it is also a fact that there is a bias in the news: if the Elizabeth project was in time and budget, it would probably had not come to the main pages of the newspapers.
- Of course, it is difficult to have a precise understanding of what is actually happening in "capital projects", as it is a too wide and heterogeneous subject, and reporting is sparse and uneven. But we can probably get a reasonable idea through some samplings from diverse sources:
- More than 75% of capital projects have budget overruns, which amount to more than 50% of the initial budget in half the projects.
- At least 90% of major capital projects have budget overruns which, on average, is around 30%.
- In very large projects (in excess of, say, 1 billion USD) the average overrun is not a good indicator because these projects tend to create large budgetary holes (the statistical tail for the large overruns is not thin).
- One in six big IT projects had a cost overrun of 200%, on average, and a schedule delay of almost 70%.
- Only 5% of industrial light and heavy industrial capital projects fit into “best in class” with regard to cost and schedule predictability.
Perhaps this is something of the past, and new management techniques are keeping this under control. Clearly not so, as indicated by the following chart for transportation projects.
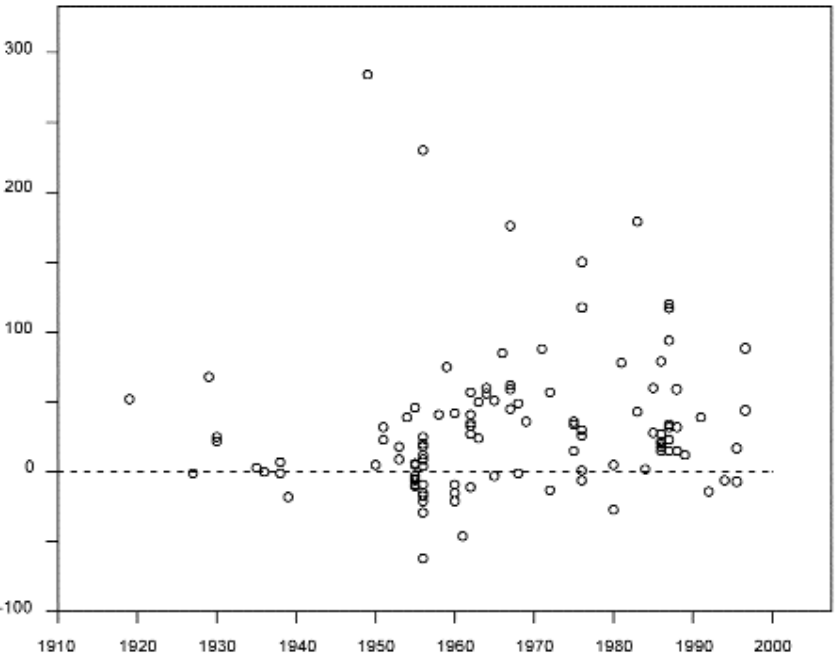
Figure 1: Inaccuracy of Cost Estimates, %
Our own experience indicates, unfortunately, that the cement industry is rather well represented by the previous snapshots from other industries.
Major consultancy firms state that they know how to fix this terrible situation. Depending on the case or fashion you may need to increase your Project Management Pool, fix the Lessons Learned step, improve Risk Management practice, reinforce and improve the Communication among the Stakeholders, introduce shiny Procurement Excellence, bring a Stage-Gate Approval Process, etc.
All this is good, and who am I to say "no", or "yes, but …" to these wise recommendations.
Rather, the purpose of this document is to present a simple and tested tool, probably not much known in the cement industry, which can help project owners and managers to evaluate and track the degree of definition of a capital project. And this because there is a strong relationship between well-defined project scope and successful project completion.
2. Construction Industry Institute
The Construction Industry Institute, CII, is a private consortium "of more than 130 leading owners, engineering-contractor, and supplier firms from both the public and private arenas", based at the University of Texas (Austin). Its purpose is to support the construction industry by producing and disseminating innovative solutions and best practices that "tangibly improve safety and capital efficiency".
One of the tools developed by CII is the PDRI.
3. PDRI (Project Definition Rate Index)
There are three basic ideas behind the PDRI:
- the degree of definition of a project varies along its phases: it is low, or lower, at the beginning, and it naturally increases with its development and
- Up to a certain and relevant amount, the degree of definition at any stage is defined by project management
- At any stage, the degree of definition is related to uncertainty, which tends to be a door open to unexpected surprises, which often bring cost overruns and
Therefore, a tool which could measure this degree of definition of a capital project, and track it along its main phases, could provide valuable information on the potential risks (cost and delay) that can affect the project. If the process is simple and has benchmark references, much better.
This is what PDRI is aimed at.
CII has developed several PDRI models specific for different sets of projects (building, industrial, infrastructure), with versions for small industrial and infrastructure projects.
The structure is common to all variants:
- Three sections:
- I, Basis of project decision
- II, Basis of design,
- III, Execution approach
- Sections divided into categories; for example, section I in Small Industrial Projects is divided in:
- A Project Alignment
- B Project Performance Requirements
- Categories divided into scope definition elements; for example, category A Project Alignment is divided as:
- Project Objectives Statement
- Project Strategy and Scope of work
- Project Philosophies
- Location
The hierarchy and number of scope definition elements slightly differs among the PDRI models, but it amounts to 60-70 elements, providing a fairly grained assessment.
The scope definition elements are rated according to a discrete scale from 0 to 5:
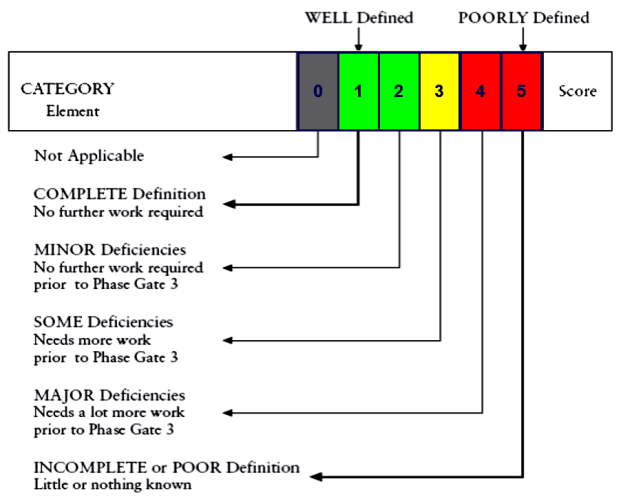
Figure 2: Rating Scale
Not all scope elements have the same importance, and the CII has introduced a non- linear weight system which has been calibrated and adapted so that the PDRI overall score ranges between 0 and 1,000. The rating scale implies that lower score is better!
Sections and divisions also have a maximum score, so it is possible to investigate their different performance.
The scope elements are explicitly defined so that their meaning is unambiguous and comparison among projects is facilitated.
As an example, the element A4 Location would include in its description items like:
- Land availability and development costs
- Legal constraints
- Labour relations
- Environmental issues
- Permitting Schedule
- Master Planning
- Available utilities
- Operational requirements and hazards
- Interface with ongoing projects or operations
- Construction/operations and maintenance access
- Security constraints
Based on the elements description the evaluation matrix is completed and the score is calculated:
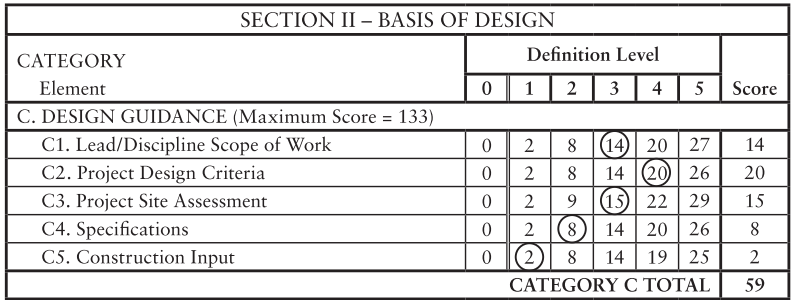
Table 1: Sample PDRI Form
4. Which Projects? Cement Projects?
Although the original methodology can clearly be adapted to any type of projects, CII provides an indication that large enough projects for which the PDRI can be most suitable are those with budget above of 10-20 USD mio with approx. 12 months of execution time. Most projects by number and cumulated capital investment fall below this threshold: they are considered small by CII, but still specific PDRI forms are available for them, as indicated above.
The lower range of suitability is harder to identify, but a tentative guidance can be in the range of 1 mio USD.
5. When to Perform a PDRI
There are two main valuable outcomes from conducting a PDRI:
- Doing the PDRI forces to a systematic and comprehensive review of the project scope which itself can serve to identify weak areas of definition, create alignment within the project team, and get early customer input and buy-in; plus
- The benchmarking with other similar projects, whose outcome with regard to budget and schedule is already
As a risk management tool, the PDRI is best used at early phases, when it can be an indicator of a loose definition work that can be often solved better at those stages (see Figure 3).
With the prevalent stage-gate approach for project approvals, PDRIs can be prepared at the decision gates. In the case of the CII’s planning model, PDIR was conceived to be applied at the end of the Front-End Planning, prior to contracting (#3 in the following image)- but it can be used more than once prior to arriving at this stage gate (PDRI-early and PDRI-final in the image).
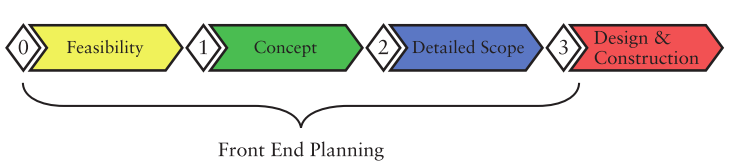
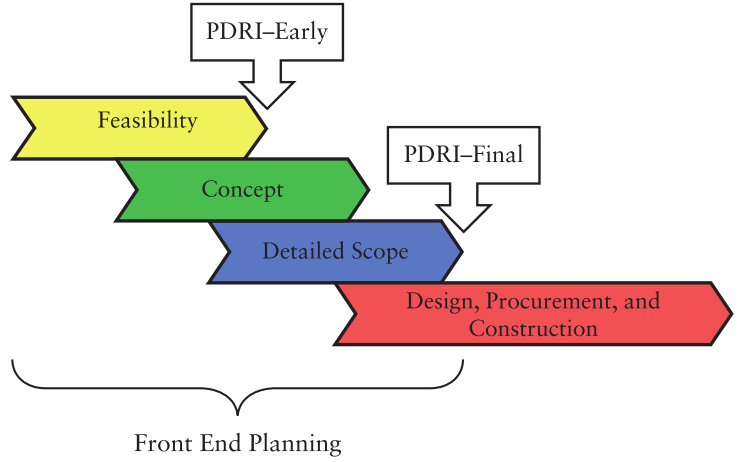
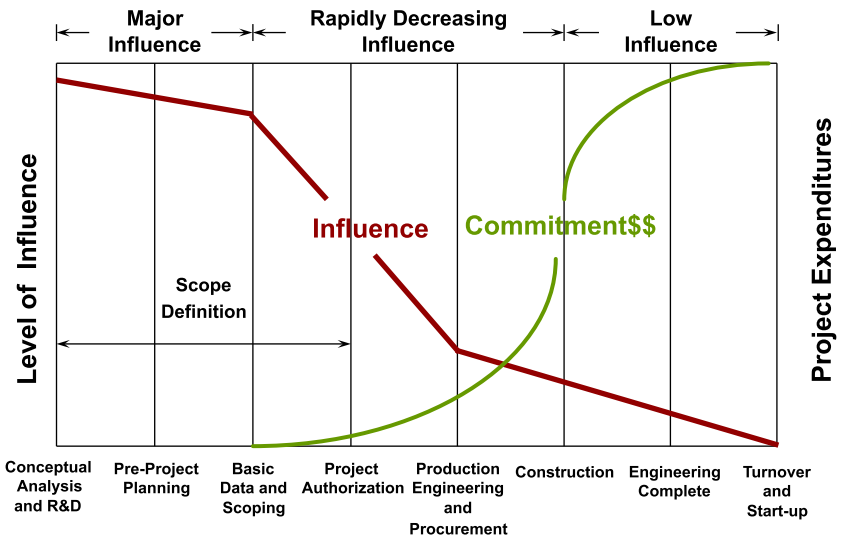
Figure 3: CII’s Project Life Cycle Diagram and Opportunity to Influence
6. What to Do with the PDRI Results?
The following tables show the results of different measurements that relate the PDRI values and the overall performance with regard to cost and schedule:
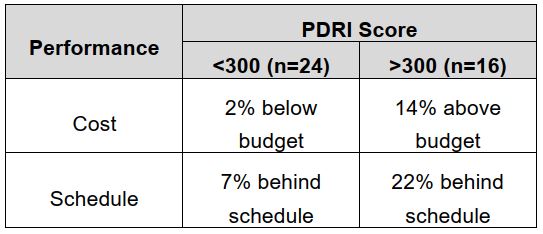
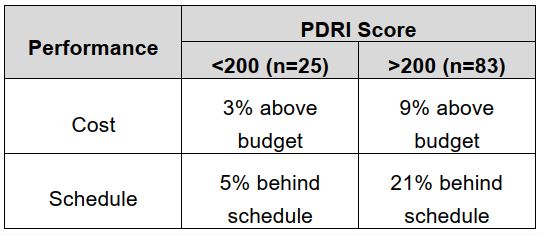
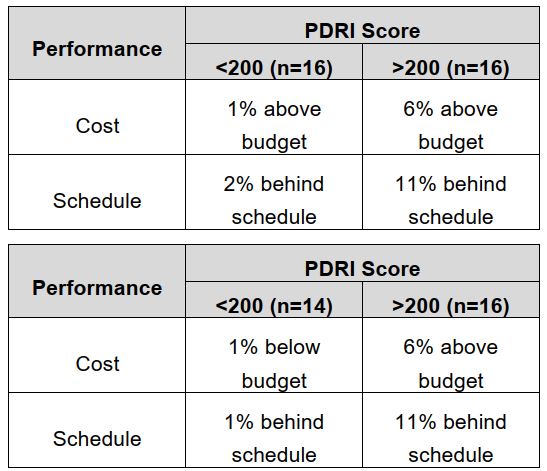
Table 2: Comparison of Project Results
These results arise for different samples of projects, and they are only intended to show the significant differences in project performance associated to PDRI scores.
Tentative good scores at various stages of the project are:
- <650 at feasibility (gate #1)
- <500 at concept stage (gate #2)
- <300 at design stage
- <200 once the project is ready to be awarded/contracted (gate #3).
With the unavoidable uncertainty of these evaluations, a PDRI score much above 200 at near-contracting stage is a flashing indicator of inadequate preparation.
7. Practical Tips
Although a PDRI can be prepared by a single person, the tool is intended to be used in large projects, which typically involve a group of experts and several stakeholders. A dedicated team session is, therefore, the recommended approach, with a broad representation of interests and knowledge. The time required to run a PDRI is typically 90-120 minutes.
The person-in-charge should ensure all relevant stakeholders are present and arrange the necessary logistics for the session (room, project documentation, etc.). The facilitator should be familiar with the project and the PDRI technique.
In order to avoid input bias, it is recommended that the participants are provided an unweighted score-sheet. The aggregated unweighted result can be obtained by open discussion of the score definition items, or by averaging the individual sheets.
The element scores of the PDRI can be seen as a gap list, which can be used as the basis for an action or task list aimed at closing the discrepancies, at last for the critical elements.
A brief document on the result of the meeting, including an After-Action section, is recommended for lessons learned and future benchmarking.